MultiCharts powered by Rithmic Data Technology is an award-winning trading software. Whether you are a new trader or a professional, MultiCharts has features that can help you achieve your trading goals. High-definition charting, built-in indicators and strategies, one-click trading from chart and DOM, high-precision backtesting, automated execution and support for EasyLanguage scripts are all key tools at your disposal. Server co-location is available for MultiCharts users.

MultiCharts | Rithmic

MultiCharts Platform Fee
- 1 Month – $79
- 12 Months – $797
- Lifetime – $1,497

Single Click Trading
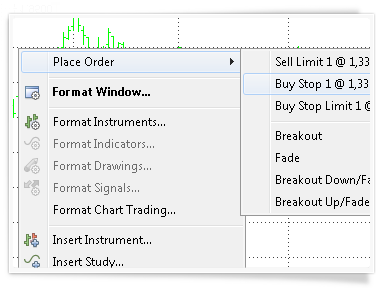
Take control of your trading and act quickly when you see an opportunity – place orders in seconds through our new Chart Trading and DOM. It’s simple and intuitive, you can click or drag-and-drop orders onto your chart.
MultiCharts features many tools to help you achieve your goals – Chart Trading, Trade Bar, Order and Position Tracker, Depth of Market, Automation of Entries and Exits, and Symbol Mapping.
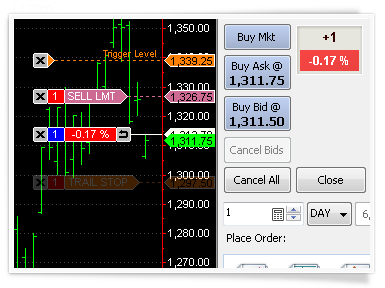
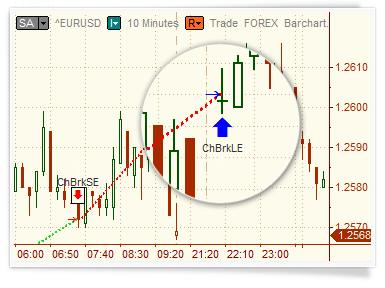
Chart Trading
Trading from a chart is one of the most popular approaches by discretionary traders – for good reason. You can see price movements along with your indicators, and recognize where appropriate levels will be for price action.
Visual chart trading keeps pace with your needs and you can intuitively drag and drop order onto your chart – no need to calculate the necessary price and type it in. An order can always be moved to another level if desired. Entire entry and/or exit strategies, like single orders, may also be dropped into a chart.

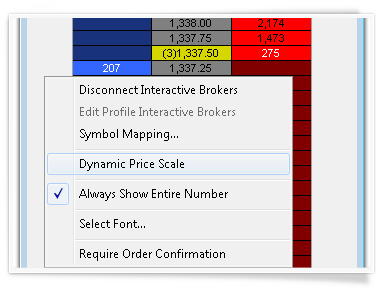
Depth of Market (DOM)
This industry-standard tool shows market depth and provides one-click trading. MultiCharts’ DOM displays ten price levels each way and allows entry and exit automation directly in the DOM window. See volume at different prices to analyze how supply and demand are interacting and where prices may go.
DOM in MultiCharts has two modes of operation: dynamic and semi-static.
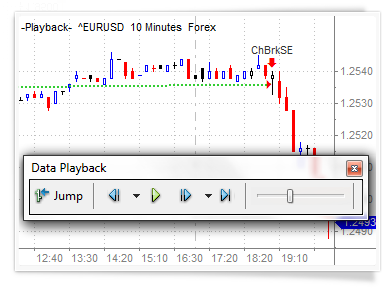
Market Data Reply
Trading the markets is all about predicting where the price will go next. A good way to practice is to apply your price-predicting skills to historical data.
Market Data Replay allows you start playback at any point in the past, speed up or slow down replay speed, and even playback several instruments at once.

Strategy Backtesting
Portfolio backtesting is a very complex and powerful tool, which often is sold as a separate product. Portfolio backtesting is very different from regular strategy backtesting because it looks at all instruments in your portfolio as one whole, which often means hundreds or thousands of symbols. The 64-bit version of MultiCharts is capable of handline huge amounts of data needed for all those symbols.
Portfolio backtesting means applying one or more strategies to many instruments at once—testing on historical data and gauging performance as if all symbols were traded with these strategies. Different symbols can even have different resolutions during the testing—one tick, three minutes, nine days, or others.
Time and Sales
Tape reading has been successfully used by traders since the middle of 19th century. Time and Sales shows at which price a trade was filled – at bid, ask or between them. Also, it displays the amount of volume that each trade includes. This information tells you whether there are currently more buyers or sellers, and also what prices they are buying and selling at.
There are 100,000′s of transactions each day and and a trader needs a tool that is capable to filter noise and to aggregate the information for decision making.

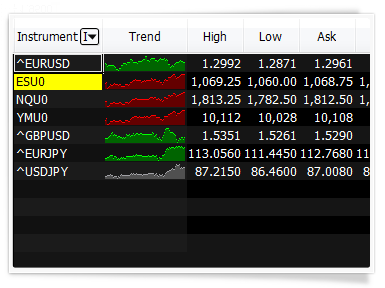
Market Scanner
Scan all symbols universe one-by-one with a specified frequency and at the same time monitor hundreds of selected instruments in real-time. Now thousands of instruments can be automatically sorted out from the whole market according to your indicator criteria for further updating in real-time.
Market Scanner is a watchboard for monitoring symbols you are interested in and finding opportunities. The new version of our Scanner has two components: Pre-Scanning and Watchlist windows. While a single chart gives you details about one symbol, the Scanner allows you to spot opportunities among thousands of symbols.
Dynamic Portfolio Backtesting
Proper backtesting helps you determine if your strategies will make or lose money.
Dynamic portfolio backtesting is capable of applying your strategy to many symbols on a bar-by-bar basis, determining which trade is the optimal one at any given time. It can be an invaluable tool during technical analysis and strategy development.
Genetic Strategy Optimization
Some traders find optimization very useful as it saves a lot of time searching for optimal inputs for a particular strategy.
Genetic optimization employs a complex algorithm that tests possible inputs in a way that mimics biological evolution. This approach is a lot faster than trying every possible combination, and it also helps avoid outliers and curve-fitting.


EasyLanguage Support
EasyLanguage is a programming language that was developed by TradeStation Securities. It is a popular language because it’s easy to learn without specialized training, but at the same time, it is very powerful for trading purposes. The popularity of this language is so widespread that it can be considered the standard programming language in the trading industry.
EasyLanguage code has been in development for more than 20 years, which means it has one of the biggest collections of trading ideas in the world already implemented. EasyLanguage indicators and strategies are widely available across the internet and in major trading publications, which gives all MultiCharts users an advantage over people using other platforms.
Volume Profile
The importance of volume analysis cannot be underestimated. Paying attention to volume can make the crucial difference in understanding how the market will move. The following tools were designed to help you understand not only how much was bought, but at which prices activity was the highest, and whether there are more buyers than sellers.
Volume Profile is a vital tool that shows the most traded prices for a particular time period. It plots volume as a histogram on the price bar, so you can see the levels where you need them.


Data Management
MultiCharts has a local data management and storage system called Quote Manager. It collects and locally stores all of the data received from the data feeds. Quote Manager handles all aspects of data maintenance and offers convenient database and management features for your symbols.
You can use two separate data sources in one chart—one for historical data and one for real-time data. This advanced feature resolves the situation where a broker provides real-time data but not historical data.