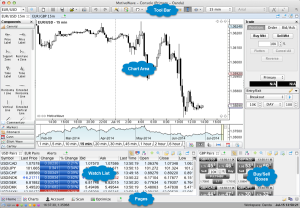
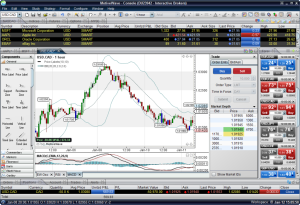
MotiveWave powered by Rithmic Data Technology is an easy-to-use professional charting, technical analysis and trading platform, built for the individual trader, that also specializes in advanced analysis tools like Elliott Wave, Fibonacci, Ratio Analysis , Gartley and Gann. Server co-location is available for MotiveWave users.

MotiveWave | Rithmic

MotiveWave Lifetime License Fee
- Analyst – $99
- Trade – $295
- Professional – $995
- Ultimate – $1,595

Elliott Wave
MotiveWave has the most advanced Elliott Wave Software and Elliott Wave Tools available. Elliott Wave Tools range from manual to semi-automatic to automatic Elliott Wave to suit your preference. Elliott Wave labels are always automatically added for you, cutting down your analysis time significantly. Manual Elliott Wave tools let you plot your own wave counts easily. Our Auto Elliott Wave tool will fill in Elliott Wave counts automatically on one chart based on a selected area of a chart. Our Auto Analyze Elliott Wave tool will automatically plot Elliott Waves over a specified range of data to a specified level of decomposition on one chart. The Elliott Wave Scanner (pattern recognition tool) allows you to search for specific Elliott Wave Patterns across multiple symbols/instruments based on options you choose. All wave counts can be moved or adjusted after being placed on the chart and can be decomposed as many levels as you want.
MotiveWave supports all Elliott Wave Patterns and Degrees, as mentioned in the book, Elliott Wave Principle: Key To Market Behavior by A.J. Frost and Robert R. Prechter Jr. All Elliott Wave Theory Rules and Guidelines are enforced in MotiveWave, with warnings on what rule or guideline has been broken so that you can adjust the placement of your count. This shortens your learning curve with Elliott Wave significantly and allows you to be more confident in your wave counts.
MotiveWave allows you to easily compose or decompose wave formations to multiple levels and perform time and ratio analysis on the waves to forecast future price direction and buy / sell points.
Fibonacci
MotiveWave provides a diverse and very advanced set of Fibonacci Tools (30 Fibonacci components including retracement, extension and expansion levels, Arcs, Fans, and more) that can be applied to many analysis tools within MotiveWave. Combine Elliott Wave and Fibonacci for price, time and ratio analysis to determine projection levels. Fibonacci Ratio labels are added for you. All Fibonacci points and labels can be manually adjusted. Show as many or as few ratios as you want on the charts. MotiveWave also allows you to create your own custom Ratio Sets and Styles.
Gartley
MotiveWave has a very advanced set of Gartley tools that come in manual, semi-automatic and automatic Gartley to suit your preference. There are 20 manual Gartley components (bull and bear) that you can add to the charts, including Gartley pattern, Butterfly, Crab, Bat and more. Shaded areas and ratio label guides allow you to easily place points on the chart to wire up the patterns correctly. Our Auto Gartley tools allow you to select an area of a chart to search for either a Gartley or ABCD pattern. The Gartley Scanner (pattern recognition tool) allows you to search for specific Gartley Patterns across multiple symbols/instruments based on options you choose. All Gartley patterns can be moved or adjusted after being placed on the chart.


Gann
MotiveWave has 27 Gann components, including Gann Fan, Wedge, Angles, Ratio Grid and more. MotiveWave also enables you to perform Gann time and ratio analysis.
Alternate Analyses
MotiveWave has a unique concept of creating an alternate analysis. It is normally used with Elliott Wave analysis for exploring alternate outcomes, but can be used for any advanced technical analysis. Charts in MotiveWave can be saved so you don’t lose your analysis. An alternate analysis lets you look at a possible diverging outcome in a separate chart so you don’t have two analyses competing or looking too busy on a chart. You can choose to start your Alternate Analysis based on an existing chart and make appropriate changes to the new chart or you can start an Alternate Analysis from a clean blank chart. Either way, your original analysis is saved and will not be changed.
Trading and Order Management
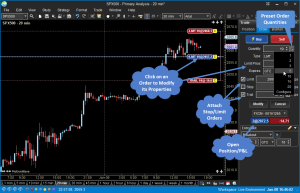
With integrated trading, MotiveWave makes it easy to place and adjust orders. Manage all of your orders directly from the console.
Replay Mode
Need to practice your prediction skills? MotiveWave’s Replay Mode allows you to start at any day and time from the past and playback historical market data from that point. A floating toolbar gives you quick access to all of the Replay controls. Choose tick or bar data and set the time delay between each tick or bar. This allows you to playback months of data at a fast rate. Speed up, slow down, or pause the playback with a single click. You can also run multiple charts in Replay Mode at the same time.


DOM (Depth of Market)
Market Depth is a great tool for traders that shows the number of open buy and sell orders for a specific symbol or instrument and can show hidden levels of support and resistance. MotiveWave’s DOM (Depth of Market) window has configurable preferences including the number of rows you want to see, Font Size and Style, and more. Choose one-click or double-click to place an order, or set an Order Ticket Window to open instead. Orders can be placed and cancelled with one click. Orders can be modified by clicking and dragging to a different price. As well as the DOM, you can also see Market Depth on each chart by opening the Trade Panel on a chart.
Chart Groups
Chart Groups allow you to group a set of charts together into a separate window for easy access. These can be anything you want, like a specific watchlist you have, or a group of similar symbols or instruments, like USD pairs. If you have limited screen space, Chart Groups allow you to quickly switch from one set of charts to another. You can also choose a specific layout from our templates for each Chart Group or create your own layout.
Chart Templates
If you continually use the same set of studies on your charts, you can load those studies onto a chart and then save it as a Chart Template. When you open a new chart, you can apply the Chart Template and the studies will automatically be added instead of you having to add each study individually to each chart.
Chart Linking
Chart Linking allows you to link charts together either by Symbol or by Time Frame. For Symbol linking, you would have one symbol open in multiple charts with different time frames (i.e. SPX 500 for 20 minutes, 1 hour, and 1 day). When you switch the symbol, all of your different time frame charts will update to that new symbol (i.e. USD/JPY for 20 minutes, 1 hour, and 1 day). For Time Frame linking, you would have multiple symbols open with the same time frame (i.e. AUD/USD, USD/JPY and EUR/CHF for 45 minutes). When you switch the time frame, all of your symbol charts will update to that new time frame (i.e. AUD/USD, USD/JPY and EUR/CHF for 90 minutes). Chart Linking can be used on any charts and within Chart Groups.
Market Scanners
MotiveWave has three types of Market Scanners: Elliott Wave, Gartley, and Studies. With MotiveWave Scanners, you can choose as many symbols/instruments and watch lists to scan as you like. Based on the type of scan you choose, you can specify different options to use, including Bar Size, number of bars to scan, specific patterns or studies and attributes of each. Results of the Scan will be displayed with a ranking score to show which results have the best matches. Scans can be saved to be reused later.
Studies
MotiveWave has over 250 different studies/strategies, including Volume Profile, Pivot Points, Multiple Instrument Overlay, CCI, MACD, SMA, RSI and Bollinger Bands®.


Alerts
MotiveWave has the ability to create alerts based on studies, price action, or on signals generated by studies. You can have the Alerts show on the price axis or volume axis or have an email Alert sent. You can also use your own custom sounds for Alerts.
Renko/Range bars
MotiveWave supports Renko bars and Range bars. Range and Renko bars can be calculated using minute or tick data.
General Analysis Components
MotiveWave provides many components and tools for performing general analysis functions, including Trend Lines, Channels, Linear Regressions, Pitchfork, Price and Time labels, Support and Resistance Zones, Time and Price Ranges, Cycles, Curves, Circles and more. All components can be moved, edited and formatted.
Quote Sheets
MotiveWave’s Quote Sheets allow you to monitor thousands of symbols, grouped the way you want to see it, so that you can see a snapshot of the market as a whole. Choose the columns you want to see and the order you want the columns in. Group the symbols by type (Futures, Forex, Stocks, etc.), group by your portfolio vs. a watch list you’re interested in, or by industry — the possibilities are endless. Easily open a chart by double-clicking or right clicking on the symbol.
Strategy Trading
MotiveWave offers start to finish trading strategy features including strategy backtesting, replay mode, strategy optimization, walk-forward testing, and backtesting reporting.
Trade Manager
MotiveWave includes a custom entry/exit strategy called Trade Manager. This strategy allows to you configure custom entry and exit orders to conveniently enter and exist positions on the close of a bar.
News
MotiveWave includes integrated news directly into the console and chart windows.
Preferences
MotiveWave is highly customizable to your preferences. There is a Preferences screen which allows you to customize your chart settings, themes, tool bar, mouse behavior, order presets, hot keys, sounds, and more.


